You can use the dashboard to keep track of all streaming activity on your account so as to be able to keep track of your spending limits.
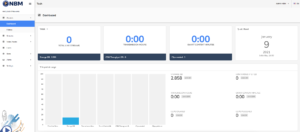
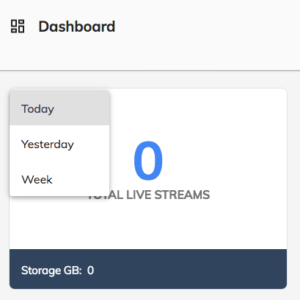
You will be able to watch several consumption metrics based on the selection of a particular period as Today, Yesterday or current week:
The parameters to be watched into the dashboard are:
– Total Live Streams
There are the number of streams that have been hosted during the selected period.
– Transmission Hours
This shows the amount of hours that have been used up during the selected period.
– Smart Content Minutes
This is a calculation based on the amount of usage that has been used during the selected period.
Period Usage Graphics
Within here, you can see an allocation of which parts of your activity have used the amount of allocated space or bandwidth. This can include storage (in GB), CDN throughout (also in GB), transmission hours, clip creation, smart content analysis (of which there is a limit of 25), and clips created and published (limited to 36).
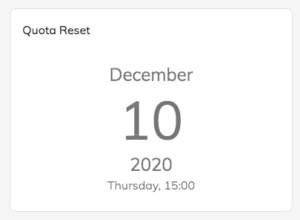
You can also see the date and time of your next quota refresh on the upper right of the screen.
Term Definitions:
– Storage GB – this is the amount of the storage space that you have used up on our servers. A limit shows, showing the amount of space that you have been allocated according to your service plan, or by any a la carte purchases, and then the amount that has been used by your existing videos.
– CDN Throughput GB – This is a measure of bandwidth. Using our Content Delivery Networks (CDN) we allow a certain amount of streaming activity to occur for each service subscription. On this screen we show a limit, which is the amount that you have purchased, and the amount of streaming data that have been used.
– Transmission Hours – This is a sum of the number of hours of streaming time that have been used. For a plan that allows 24 hours of transmission hours, you are allocated 24 hours of streaming material. The numbers show the number of hours that have been consumed per payment period.
– Smart Content Analysis – Smart Content Analysis refers to the service provided by our machine learning tools to help identify important metadata associated with your video, including any identified celebrities, entities, and more. You are shown the number of smart content analysis instances that can be performed within a given period, and the number that have been used.
– Clip Creation – This is the number of clips that you have created from longer videos.
– Clip Publish – This is the number of clips that have been published.
Finally, you will also be able to check when your Quota Consumption will be renewed on the upper right corner of your Dashboard:
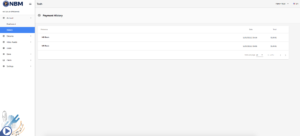
History
Here is where you can see a history of transactions, including your initial subscription, subscription upgrades, name of the add-on products, the date of the purchase, and the total amount spent.
| <<< Previous | Next >>> |